
Zona
Franca
Barranquilla
We grow with passion and joy to generate more and more well-being
Barranquilla Free Trade Zone, a Pioneer in Colombia, has an area of 1,000,000 M² located in the heart of the port of the city of Barranquilla, with an Interconnection Gate with the Barranquilla Regional Port Society, it becomes the only Free Trade Zone in Colombia with direct entry from ¨Puerto - Zone¨ thus allowing agile and safe access to the cargo.
With its traditional industrial profile of goods and services, commercial, logistics and port, it is one of the industrial development poles of the Colombian Caribbean region.
- It has a dynamic trade.
- It has great international projection.
- It is aimed at promoting the generation of employment and foreign exchange for the country.
This platform of high industrial management with maritime and fluvial Free Port is the appropriate place for the development of national and / or foreign companies that avail themselves of the benefits of the Franco Regime in search of growth and greater competitiveness in the national and / or international market .
Barranquilla Free Zone has the ability to offer rental of areas for installation at truly competitive costs in the industrial market, with an adequate physical infrastructure, technical assistance and comprehensive security.
Likewise, seeking to satisfy current and future users, the Barranquilla Free Trade Zone has a variety of services such as specialized consultancies, offered in an agile, reliable, efficient and accurate manner for the excellent development of its activities.
Objectives and Policy
SIG Policy
We establish within our policies the commitment to:
- Satisfy the requirements of our clients, legal and other applicable ones, providing services in an agile, reliable and transparent way, maximizing the profitability of our clients with experience, security and infrastructure.
- Generate environmental awareness in the development of our activities, in order to act accordingly, promote it and make it reach our stakeholders.
- Offer our workers optimal levels of physical and social well-being.
- Assume the best practices for comprehensive risk management, promoting and facilitating the development of skills of our staff.
- Reject any manifestation or criminal practice, such as drug trafficking, terrorism or smuggling.
- Continuously improve all our processes.
SIG goals
- Increase customer satisfaction.
- Increase the number of clients.
- Encourage compliance with the requirements associated with the provision of services.
- Guarantee the reliability of foreign trade operations.
- Promote sustainable consumption.
- Promote operational excellence.
- Have the ideal human talent at the required time.
A world of services to compete and win in international markets.
Commercial
Customer satisfaction
We maximize the profitability of our clients
Operational excellence
We do things well, and each time better
Our Commitment
We share our success
TYPES OF FREE ZONES
Permanent Free Zones
Special Permanent Free Zones
Transitory Free Zones





Some users of the Barranquilla Free Trade Zone


FRUTTCO SAS

TRANSCONT ZONA FRANCA SAS

CORPACERO ZONA FRANCA S.A.S

Casa Santana Ron y Licores S.A.S:

Casa de la Válvula S.A

AGENCIA DE ADUANAS SERVADE SA NIVEL1

AGENCIA DE ADUANAS HERMANN SCHWYN CIA SA NIVEL 1

AGENCIA DE ADUANAS ADUANAMIENTOS LTDA NIVEL 1

Prudencial Services S.A.S.

ZF Auditores Especializados S.A.S.

Logística e inversiones global Inglobal SA

Terminal Químico Zona Franca SAS
Agencia De Aduanas Roldan S.A.S. Nivel 1

Retycol S.A.S

Portmagdalena S.A.

Inversiones Miros S.A.S.

Mademeco S.A.

I.B.S. Zona Franca S.A.

Comercial De Negocios Zona Franca S.A.

Barranquilla Industrial de Confecciones SA

Grupo ALIAZO S.A.S
National and International Distances
| DESTINATION | DISTANCE |
| CARTAGENA – BARRANQUILLA | 100,18 km |
| SANTA MARTA – BARRANQUILLA | 103,00 km |
| BOGOTÁ D.C. – BARRANQUILLA | 712,49 km |
| MEDELLÍN – BARRANQUILLA | 532,12 km |
| CALI – BARRANQUILLA | 861,13 km |
| BUENAVENTURA – BARRANQUILLA | 830,04 km |
| BUCARAMANGA – BARRANQUILLA | 468,90 km |
| IPIALES – BARRANQUILLA | 1,165 km |
| MAICAO – BARRANQUILLA | 281 km |
| DESTINATION | DISTANCE |
| MIAMI, US – BARRANQUILLA | 1.740,05 km |
| FORT LAUDERDALE, US – BARRANQUILLA | 1.774,80 km |
| NUEVA YORK, US – BARRANQUILLA | 3,310.32 km |
| LOS ÁNGELES, US – BARRANQUILLA | 5,094.89 km |
| OTTAWA, CN – BARRANQUILLA | 3,819 km |
| VANCOUVER, CN – BARRANQUILLA | 6,140 km |
| CIUDAD DE PANAMÁ, PN – BARRANQUILLA | 611.95 km |
| CIUDAD DE MÉXICO, MX – BARRANQUILLA | 2.771,76 km |
| QUITO, EC – BARRANQUILLA | 1,306 km |
| CARACAS, VE – BARRANQUILLA | 866 km |
| BRASILIA, BR – BARRANQUILLA | 4,184 km |
| SANTIAGO DE CHILE, CL – BARRANQUILLA | 4.957,11 km |
| ORANJESTAD, AW – BARRANQUILLA | 551.12 km |
| PUNTA CANA, DO – BARRANQUILLA | 995.93 km |
| ROTTERDAM, NL – BARRANQUILLA | 8.314,68 km |
| MADRID, ES – BARRANQUILLA | 7.624,19 km |
| BARCELONA, ES – BARRANQUILLA | 8,118.17 km |
| ANKARA, TR – BARRANQUILLA | 10,697 km |
| DUBAI, AE – BARRANQUILLA | 13.273,32 km |
| SHANGHAI, CN – BARRANQUILLA | 17.006,39 km |
| TOKYO, JP – BARRANQUILLA | 13,705 km |
Our figures
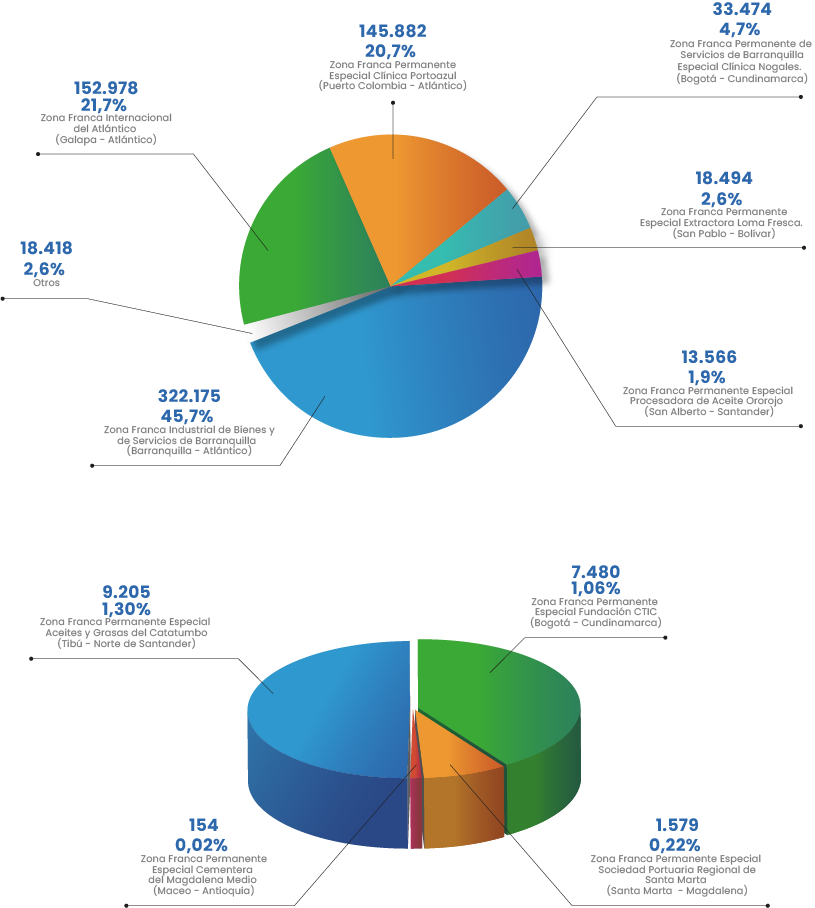
Movimientos
Valor FOB - 2022 (3.771,6 Millones USD)
46,8%
con respecto al 2021
| ZONA FRANCA | 2022 | 2021 |
|---|---|---|
| Zona Franca Industrial de Bienes y de Servicios de Barranquilla | 2.966,3 | 1.751,2 |
| Zona Franca Internacional del Atlántico | 439,4 | 310,7 |
| Zona Franca Permanente Especial Aceites y Grasas del Catatumbo | 113,8 | 78,0 |
| Zona Franca Permanente Especial Clínica Nogales | 68,0 | 149,7 |
| Zona Franca Permanente Especial Procesadora de Aceite Ororojo | 58,3 | 48,3 |
| Zona Franca Permanente Especial Extractora Loma Fresca | 50,5 | 35,1 |
| Zona Franca Permanente Especial Fundación CTIC. - Luis Carlos Sarmiento Angulo | 45,6 | 50,1 |
| Zona Franca Permanente Especial Clínica Portoazul | 19,9 | 83,9 |
| Zona Franca Permanente Especial Sociedad Portuaria Regional de Santa Marta | 9,8 | 61,7 |
| Zona Franca Permanente Especial Cementera del Magdalena Medio | 0,2 | 0,1 |
| MOVIMIENTOS TOTALES | 3.771,6 | 2.568,8 |
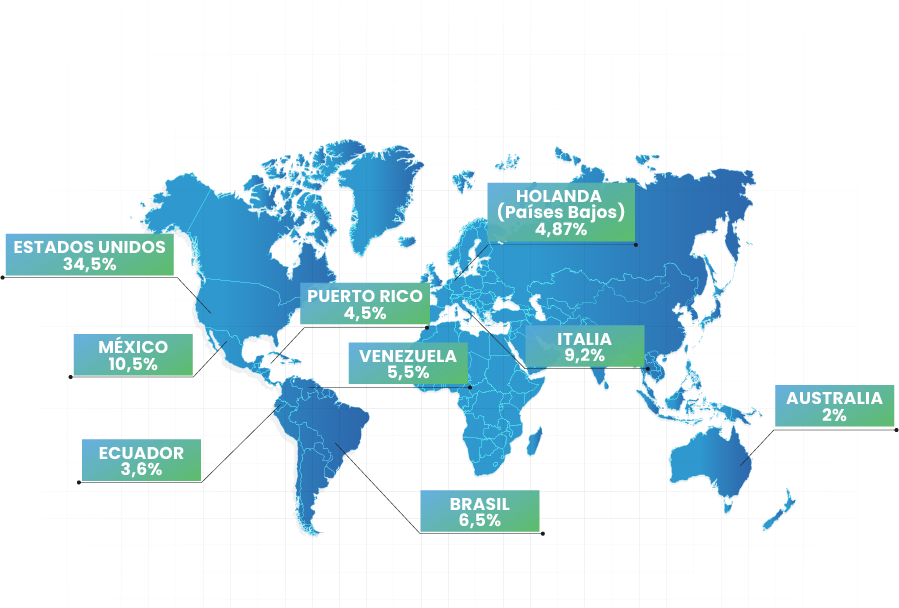
Exportaciones
Valor FOB - 2022 (650 Millones USD)
80 Paises destino
Exportaciones
Valor FOB - 2022 (650 Millones USD)
56%
Incrementó
con respecto
al
2021
| SECTORES | Salidas RM TOTALES |
Salidas RM (Bienes + Valor agregado) |
|---|---|---|
| Hidrocarburos, aceites y derivados | 256,91 | 2,50 |
| Agroquímicos | 219,92 | 145,16 |
| Alimentos y bebidas | 46,43 | 46,34 |
| Manufacturas de plástico | 28,92 | 28,80 |
| Químicos | 17,21 | 0,13s |
| Warehouses | 14,11 | 0,00 |
| Servicios logísticos | 14,07 | 0,11 |
| Confections | 11,06 | 3,83 |
| Boats | 10,93 | 10,93 |
| Metalmecánica | 10,89 | 10,89 |
| Cosmetics | 5,34 | 5,34 |
| Wood | 4,67 | 4,67 |
| Cuero y calzado | 3,38 | 3,32 |
| Marroquineria | 2,61 | 2,61 |
| Manufacturas de cobre | 1,23 | 1,20 |
| Farmacéutico | 1,19 | 1,19 |
| Construction | 0,73 | 0,73 |
| Empaques | 0,38 | 0,16 |
| MOVIMIENTOS TOTALES | 650 | 268 |
Operaciones de Comercio Exterior
704.987
1,6% con respecto al 2021
| EXPORTS BY ZFBAQ SECTOR | ||||
| Sum of FOB VALUE USD$ | ||||
| row labels | 2021 | 2020 | 2019 | Grand Total |
| ABONOS | 131.847.658 | 107.666.399 | 95.536.552 | 335.050.609 |
| ALIMENTOS Y BEBIDAS | 39.722.877 | 28.673.794 | 35.677.546 | 104.074.217 |
| ALMACENADORA | 922.296 | 217.923 | 11.960 | 1.152.178 |
| ALMACENADORAS | 2.426.714 | 3.489.737 | 8.893.422 | 14.809.872 |
| BARCOS Y NAVES | 9.196.364 | 6.830.764 | 7.778.386 | 23.805.515 |
| CONFECCIONES | 6.942.684 | 3.759.035 | 5.787.963 | 16.489.682 |
| CONSTRUCCIÓN | 145.300 | 554.224 | 2.507.138 | 3.206.661 |
| COSMÉTICOS | 6.767.895 | 7.432.994 | 13.226.555 | 27.427.443 |
| CUERO Y CALZADO | 2.708.169 | 1.402.168 | 1.808.814 | 5.919.150 |
| HIDROCARBUROS | 181.705.684 | 99.042.632 | 99.178.799 | 379.927.115 |
| MADERA | 2.051.142 | 1.562.938 | 1.633.261 | 5.247.342 |
| MANUFACTURAS DE COBRE | 1.577.725 | 2.010.376 | 2.364.037 | 5.952.138 |
| MANUFACTURAS DE PLÁSTICO | 16.442 | 21.320 | 37.762 | |
| METALMECANICA | 233.458 | 163.311 | 8.765.690 | 9.162.459 |
| REPUESTOS Y MAQUINARIA PESADA | 270.000 | 10.080 | 280.080 | |
| SERVICIOS LOGÍSTICOS | 10.632.396 | 3.214.929 | 2.580.381 | 16.427.705 |
| Grand Total | 396.880.361 | 266.307.664 | 285.781.903 | 948.969.929 |
| EXPORTS BY COUNTRY ZFBAQ | ||||
| Sum of FOB VALUE USD$ | ||||
| Country | 2021 | 2020 | 2019 | Grand Total |
| ESTADOS UNIDOS | 110.841.259 | 67.402.262 | 108.281.696 | 286.525.216 |
| ITALIA | 82.709.381 | 8.501.942 | 5.052.751 | 96.264.074 |
| ECUADOR | 28.571.104 | 26.166.115 | 37.731.990 | 92.469.210 |
| PANAMA | 796.567 | 55.524.405 | 31.070.067 | 87.391.039 |
| HOLANDA (PAISES BAJOS) | 28.168.841 | 18.787.312 | 5.578.334 | 52.534.487 |
| VENEZUELA | 20.208.171 | 10.306.632 | 18.336.970 | 48.851.773 |
| MEXICO | 20.772.956 | 12.211.928 | 8.242.611 | 41.227.495 |
| PERU | 14.719.129 | 15.116.889 | 8.544.115 | 38.380.132 |
| BRASIL | 22.028.859 | 7.982.585 | 3.533.112 | 33.544.557 |
| AUSTRALIA | 8.356.953 | 5.867.075 | 7.224.443 | 21.448.471 |
| ARGENTINA | 4.886.458 | 3.445.947 | 10.705.887 | 19.038.292 |
| CANADA | 4.454.365 | 7.480.586 | 1.425.895 | 13.360.846 |
| CHILE | 5.462.624 | 4.102.952 | 3.752.792 | 13.318.368 |
| ARUBA | 128.238 | 8.866.313 | 8.994.551 | |
| ESPAA | 1.765.082 | 1.326.733 | 5.890.726 | 8.982.541 |
| REPUBLICA DOMINICANA | 6.847.534 | 1.133.131 | 674.995 | 8.655.660 |
| COSTA RICA | 3.614.085 | 1.784.858 | 1.394.372 | 6.793.315 |
| GUATEMALA | 2.709.402 | 2.509.918 | 1.309.038 | 6.528.359 |
| EGIPTO | 641.180 | 1.226.831 | 3.484.477 | 5.352.488 |
| PUERTO RICO | 2.631.314 | 2.100.484 | 379.381 | 5.111.179 |
| SUDAFRICA, REPUBLICA DE | 4.024.508 | 150.029 | 291.492 | 4.466.029 |
| LIBIA | 1.557.600 | 939.721 | 531.327 | 3.028.648 |
| RUSIA | 1.910.220 | 752.441 | 119.916 | 2.782.577 |
| ISRAEL | 1.220.838 | 1.253.926 | 263.873 | 2.738.637 |
| PORTUGAL | 743.494 | 752.639 | 1.148.494 | 2.644.627 |
| REINO UNIDO | 474.889 | 257.631 | 1.264.729 | 1.997.249 |
| BOLIVIA | 1.081.774 | 420.847 | 438.293 | 1.940.915 |
| SUIZA | 1.912.958 | 36 | 1 | 1.912.995 |
| UCRANIA | 1.686.192 | 194.868 | 1.881.060 | |
| BAHREIN | 1.647.030 | 1.647.030 | ||
| CUBA | 166.796 | 1.314.455 | 5 | 1.481.256 |
| COREA (SUR), REP. DE | 515.143 | 357.858 | 530.735 | 1.403.736 |
| NIGERIA | 1.370.600 | 1.370.600 | ||
| TAIWAN (FORMOSA) | 936.582 | 273.709 | 145.484 | 1.355.774 |
| FRANCIA | 313.784 | 602.373 | 367.824 | 1.283.981 |
| HONG KONG | 349.512 | 282.201 | 572.055 | 1.203.769 |
| ARABIA SAUDITA | 923.899 | 138.927 | 34.704 | 1.097.530 |
| NUEVA ZELANDIA | 424.950 | 304.376 | 279.915 | 1.009.241 |
| COCOS (KEELING), ISLAS | 72.643 | 883.547 | 956.190 | |
| EMIRATOS ARABES UNIDOS | 296.500 | 338.432 | 269.030 | 903.962 |
| HONDURAS | 103.322 | 523.878 | 214.675 | 841.874 |
| NICARAGUA | 342.747 | 435.249 | 60.577 | 838.572 |
| CURACAO | 21.213 | 82.837 | 709.284 | 813.334 |
| JAMAICA | 277.318 | 198.645 | 287.457 | 763.420 |
| SINGAPUR | 179.734 | 543.065 | 722.799 | |
| INDONESIA | 150 | 714.656 | 714.806 | |
| TAILANDIA | 107.323 | 34.406 | 567.118 | 708.846 |
| TURQUIA | 211.277 | 363.275 | 96.822 | 671.373 |
| VIRGENES, ISLAS (BRITANICAS) | 295.098 | 346.482 | 641.580 | |
| DINAMARCA | 348.233 | 224.681 | 62.282 | 635.196 |
| EL SALVADOR | 142.774 | 308.312 | 171.537 | 622.623 |
| FINLANDIA | 289.260 | 112.078 | 200.185 | 601.523 |
| ARGELIA | 404.255 | 51.914 | 104.153 | 560.322 |
| PARAGUAY | 384.621 | 169.408 | 7 | 554.036 |
| ANTILLAS HOLANDESAS | 101.026 | 13.980 | 408.502 | 523.508 |
| TUNEZ | 76.006 | 240.531 | 194.224 | 510.761 |
| LIBANO | 103.172 | 135.426 | 234.476 | 473.074 |
| POLONIA | 377.795 | 377.795 | ||
| ANGOLA | 362.174 | 362.174 | ||
| URUGUAY | 170.009 | 60.652 | 106.731 | 337.392 |
| MARRUECOS | 188.357 | 82.409 | 60.168 | 330.934 |
| AFGANISTAN | 325.113 | 325.113 | ||
| BELGICA | 127.047 | 191.051 | 318.098 | |
| GUADALUPE | 38.327 | 100.930 | 119.072 | 258.329 |
| GUYANA | 248.350 | 248.350 | ||
| KUWAIT | 56.572 | 50.812 | 134.012 | 241.396 |
| FILIPINAS | 63.004 | 176.763 | 239.767 | |
| ALEMANIA | 23.434 | 56.701 | 152.713 | 232.848 |
| MARTINICA | 46.785 | 54.461 | 106.277 | 207.522 |
| MALTA | 117.749 | 47.658 | 40.953 | 206.360 |
| ANTIGUA Y BARBUDA | 77.049 | 45.520 | 72.098 | 194.667 |
| CHINA, REP. POPULAR DE | 32.977 | 1.592 | 153.111 | 187.681 |
| GRECIA | 89.058 | 87.420 | 176.478 | |
| BERMUDAS | 128.910 | 20.864 | 25.402 | 175.176 |
| VIETNAM | 4.500 | 160.500 | 165.000 | |
| FEROE, ISLAS | 150.136 | 150.136 | ||
| BELICE | 67.332 | 41.992 | 109.324 | |
| INDIA | 55.085 | 17.911 | 35.623 | 108.619 |
| CAIMAN, ISLAS | 97.675 | 97.675 | ||
| POLINESIA FRANCESA | 77.989 | 77.989 | ||
| GUAM | 71.850 | 71.850 | ||
| JORDANIA | 70.725 | 70.725 | ||
| GUAYANA FRANCESA | 62.241 | 62.241 | ||
| BAHAMAS | 50.963 | 7.195 | 58.158 | |
| NORUEGA | 38.560 | 13.036 | 51.596 | |
| HUNGRIA | 49.429 | 49.429 | ||
| CROACIA | 12.159 | 34.788 | 46.947 | |
| CHIPRE | 14.341 | 6.087 | 24.181 | 44.609 |
| VIRGENES, ISLAS (NORTEAMER.) | 36.380 | 36.380 | ||
| BANGLADESH | 35.543 | 35.543 | ||
| SANTA LUCIA, ISLA | 33.166 | 485 | 33.651 | |
| TRINIDAD Y TOBAGO | 5.461 | 25.491 | 30.952 | |
| DOMINICA, ISLA | 30.050 | 30.050 | ||
| GRANADA | 19.287 | 6.181 | 1.453 | 26.921 |
| S.CRISTOBAL Y NIEVES | 26.227 | 26.227 | ||
| AUSTRIA | 23.185 | 23.185 | ||
| MALDIVAS, ISLAS | 3.334 | 13.010 | 16.344 | |
| SURINAM | 8.128 | 8.017 | 16.145 | |
| MARSHALL, ISLAS | 8.095 | 8.095 | ||
| QATAR | 7.100 | 7.100 | ||
| HAITI | 6.300 | 6.300 | ||
| MONACO | 4.952 | 4.952 | ||
| KAZAJSTAN | 4.420 | 4.420 | ||
| BOTSWANA | 3.097 | 10 | 3.107 | |
| FIJI, ISLAS | 600 | 600 | ||
| KENIA | 23 | 51 | 74 | |
| (en blanco) | – | – | ||
| Grand Total | 396.880.361 | 266.307.664 | 285.781.903 | 948.969.929 |
